Pesticides applied on crop fields often end up as residues on or in fruits, vegetables, grains, and in prepared foods and beverages. A primary goal of pesticide risk-assessment science is to accurately quantify the levels of human-health risks arising from pesticide residues in food.
The Dietary Risk Index (DRI) system was developed to determine which food-pesticide combinations account for the most worrisome risks in the food supply, and which do not. We developed the DRI to:
- Compare risk levels across foods and pesticides,
- Track changes in pesticide dietary risks over time, and
- Assess the impact of where food is grown on residues and risk levels, as well as how conventional compared to organic production systems influence residues and risk levels.

The DRI is a unit-less index. It is the ratio of pesticide exposure in one serving of food relative to the maximum, allowed daily exposure to the pesticide from all sources (food, water, inhalation, and dermal).
The DRI value for a given food-pesticide combination takes into account the measured level of residues in the food, the chronic toxicity of each pesticide found, and the number of grams in a single serving of each food.
Most of the pesticide chronic toxicity data utilized to calculate DRI values come from the U.S. Environmental Protection Agency (EPA). The basic measure of a pesticide’s toxicity is the chronic Reference Dose, or cRfDs. When EPA applies an additional safety factor as called for by the Food Quality Protection Act (FQPA), a pesticide’s cRfD becomes a chronic Population Adjusted Dose (cPAD).
For biopesticides lacking chronic toxicology studies, default cRfDs are set at a value unlikely to underestimate risk.
For pesticides not registered for use in the U.S., chronic Acceptable Daily Intakes (ADIs) set by the UK-Food Standards Agency or other regulatory authorities are used. ADIs are equivalent to US EPA set cRfDs.
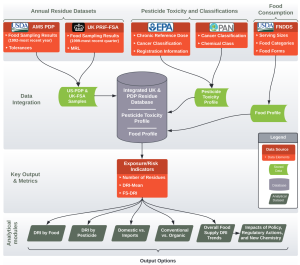
Pesticide residue data comes from the U.S. Department of Agriculture’s Pesticide Data Program (US-PDP), and the United Kingdom Food Standards Agency (UK-FSA) pesticide residue testing program. See this detailed DRI system schematic for more information on data sources and how different parameters are combined in calculating DRI levels.
Index of DRI Pages
About the DRI
- The DRI as a Tool to Measure Pesticide Dietary Risks
- History of the DRI
- Two-Page System Schematic
- Methodology Papers
- Dietary Risk Index (Benbrook and Davis, 2020)
- Individual Samples (Benbrook, 2022)
How to Use the DRI

Using the DRI to Measure Relative Pesticide Dietary Risk Levels
The basic DRI value for a food-pesticide combination is measured relative to the maximum amount of a pesticide that can be ingested in a day without exceeding the applicable, pesticide-specific regulatory “level of concern.”
Such “levels of concern” are set by the EPA following assessment of the toxicology studies submitted by pesticide registrants in their effort to gain EPA approval to apply a pesticide on a food crop.
The DRI value for a selected pesticide and food combination is a ratio. It is the residue concentration of pesticidex in foody divided by the maximum concentration of pesticidex that can be in foody without exceeding EPA’s “level of concern.”
[Add DRI equation figure here]
Tables generated by the DRI system provide key insights useful in targeting pest-management research and innovation to those crop-pest-pesticide combinations that contribute disproportionally to overall pesticide-dietary risk.
DRI outputs are also valuable in targeting regulatory interventions and alerting food companies to the need to avoid purchase of crops known to sometimes contain relatively high-risk residues.
HHRA has chosen to make the DRI widely available via a series of lookup tools on our website. These lookup tools can be used to access hundreds of thousands of tables reporting pesticide residue and DRI risk levels in many different ways and at multiple levels of aggregation. See “How to Use the DRI” for details on how different DRI tables can be drawn upon to deepen understanding of relative pesticide dietary risk levels in the global food supply.
History of the DRI
In 1984 the US EPA asked the Board on Agriculture (BoA) in the National Academy of Sciences (NAS) to carry out an analysis of the laws and policies governing the presence of cancer-causing pesticide residues in food. Project goals and scope were agreed upon between the ED of the BoA, Dr. Charles Benbrook and Dr. Jack Moore, then Assistant Administrator for Pesticides and Toxic Substances in EPA.
Following routine NAS procedures, the BoA put together a study Committee and began the analytical work needed to support the Committee’s work. It soon became clear that the new NAS Committee and the EPA’s Office of Pesticide Programs needed a new method to quantify levels of cancer risk stemming from pesticide residues in food and beverages. The Board hired Dr. John Wargo, a professor at Yale University, to lead the development of such a system. Dr. Wargo worked closely in carrying out this task with the Committee, Chuck Benbrook, and BoA staff member Richard Wiles.

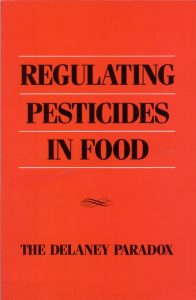
The resulting NAS report, The Delaney Paradox: Regulating Pesticides in Food, was released in 1986 and contained the first-ever attempt to quantify pesticide cancer risk across most major foods and pesticides. The methods used to accomplish this task marked the beginning of a two-decade-long process leading by the mid-2000s to the early versions of the DRI system.
A second EPA-sponsored NAS project began in 1987 and challenged the BoA to develop a method to model dietary exposures to organophosphate (OP) insecticides and neuro-developmental risks facing infants and children.
Again, the BoA turned to John Wargo to serve as a consultant. The BoA team carried out the first cumulative-risk assessment ever conducted on a large class of pesticides (the OPs) and a given adverse health impact (cholinesterase inhibition and possible developmental neurotoxicity).
Core features of today’s DRI have their roots in the novel methodologies developed to support the NAS Committee that authored the seminal 1993 NAS report Pesticides in the Diets of Infants and Children. That project first brought together Chuck Benbrook, then ED of the NAS Board on Agriculture, and Dr. Phil Landrigan, Chair of the NAS Committee that authored the 1993 report.
Today, Dr. Landrigan serves as the Chair of the HHRA Science Advisory Committee. He also is an ex officio member of the Heartland Study Management Team and the HHRA Board of Directors.
A Key Milestone: Passage of the FQPA
Three years after release of Pesticides in the Diets of Infants and Children, the US Congress passed historic legislation called the Food Quality Protection Act (FQPA). This legislation resolved the “Delaney Paradox” and added key new regulatory mandates to guard against possibly harmful pesticide exposures for pregnant women, infants, and children. The core provisions of the FQPA tracked the primary recommendations in the two BoA reports funded by EPA in the 1980s.

The FQPA became law in 1996. By then, controversy over what to do about cancer-causing pesticides in food had steadily grown for over 15 years. Dozens of prior reform bills had been drafted, vetted and promoted, but none came close to passage. Yet in the summer of 1996, the FQPA passed both the House and Senate unanimously in a matter of minutes.
Passage of the FQPA ended one chapter and began another in the evolution of the DRI. For over a decade after passage of the FQPA, Benbrook Consulting Services (BCS) worked with a variety of clients to model the impact of various proposed FQPA-implementation policies on pesticide residues in food.
To do so, BCS needed access to an easy to use analytical system that quantified pesticide risk levels in a wide variety of foods. To be credible and useful, the system had to be based on the actual levels of residues in different foods and EPA’s best estimate of each pesticide’s chronic toxicity.
The system developed in the late 1990s to quantify the impacts of FQPA-implementation policies and regulatory actions built on the work done in support of the two BoA reports in the 1980s. It expanded the range of analytical applications that could be carried out quickly and relatively easily. In the early 2000s, this analytical system came to be known as the DRI.
In 2005, the EPA’s Office of Inspector General (OIG) hired BCS to quantify the impact of EPA’s efforts to implement the FQPA on pesticide dietary risk levels. The OIG wanted BCS to determine whether, and to what extent, the EPA had taken advantage of the new provisions and mandates in the FQPA in reducing exposure and risks from OP residues in food.
The OIG’s main report was released in August 2006. A supplemental report was issued by the OIG containing the DRI-based analysis of changes in organophosphate (OP) insecticide risks conducted by BCS.
At that time, scientists in the EPA’s Office of Pesticide Programs lacked capability to quantify the impacts of the FQPA on exposures to OP insecticides across all the foods on which they were applied. This is why the OIG turned to BCS to establish a pre-FQPA baseline of OP use, residues and dietary risks from which the impacts of EPA actions and FQPA-science policies could be quantified.
In 2007, the DRI system was moved from Microsoft Excel to MS-Access. This allowed the programming of a variety of tables assessing the presence of residues, calculating mean residue levels, and quantifying DRI risk values. As new projects were undertaken by BCS, and new questions were asked and answered using the DRI, the capabilities in the core system expanded to address the differences in:
- Pesticide residues and relative risks in a food,
- For each pesticide, the residues present and risk levels in all the foods the pesticide was found in or on during a given year,
- Residues and risks in a given year in domestically grown food compared to imported food,
- The impact of organic farming on the presence of residues and risk levels in a given food compared to when the same food is grown on a conventionally managed farm,
- Changes in risk levels over time, and
- DRI risk values at varying levels of aggregation by food and pesticide.
By 2015 the DRI system was capable of producing tens of thousands of tables and hundreds of thousands of pages of output tables. The underlying databases have grown steadily to the point where some analytical tasks could no longer be carried out in MS-Access. Each new selection criteria or methodological refinement expanded the number of unique tables that could be generated. It became clear that the IT backbone of the DRI needed to move into a relational database that would support more sophisticated statistical analyses and more efficiently handle the large (and growing) files needed to run the system and generate tens of thousands of output tables.
In 2017 the Sheepdrove Trust in the UK provided a grant to the UK Soil Association to allow BCS to incorporate the pesticide-residue database compiled since 1999 by the UK-Food Standards Agency (UK-FSA).
This process substantially expanded the number and diversity of foods and beverages incorporated in the DRI system. But it also posed many methodological challenges including:
- The harmonization of pesticide names, food names, and categories of food,
- Compiling the chronic Reference Doses needed to compute DRI values for pesticides detected by the UK-FSA but not by the US-PDP, and
- Creating the ability to analyze residues and risk levels based on US-PDP and UK-FSA testing across food-pesticide combinations in ways that allow comparison of DRI values in a food tested by the US-PDP in contrast to the same food tested by the UK-FSA.

The UK-FSA residue data has now been successfully incorporated in the DRI system. This milestone markedly expands the diversity of foods now covered in core DRI tables. It transforms the DRI from a system useful in tracking pesticide residues and risk levels across the major foods consumed by pregnant women, infants and children in the US into a system encompassing much of the global food supply.
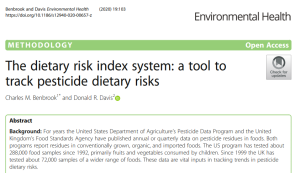
The DRI methodology paper was published in Environmental Health in 2019 (Benbrook and Davis). A second methodology paper explaining how dietary risk levels in individual samples of food can be calculated and analyzed was published in 2022.
As the DRI is utilized to carry out additional analyses, existing analytical capabilities will be refined and new ones will be incorporated in the system. In 2022, the online portal providing access to DRI-system interactive tables was transferred from Hygeia Analytica to the website of the Heartland Health Research Alliance. Access the DRI here.
